- 인터넷은 우리에게 자유를 주었습니다. 저희는 자유를 얻기 위해 지식을 통합하고 체계화하고 공유합니다. 랜선 위 정글에서 살아남기 위해 저희는 시키는 일만 하는 꿀벌 대신 고객을 위해 창조하고 혁신하는 게릴라가 되겠습니다. Seenbuy.kr is now Aiforu.kr.
- 024042463
- 01032667931
- [email protected]
Google 마이 비즈니스 통계를 구글 스프레드시트로 내보내기(Export Google My Business Insights into a Google Spreadsheet)
목차
- Google 비즈니스 통계를 가져오기
- Google Sheets 자료를 Google Data Studio로 시각화하기
- Google Data Studio로 시각화한 자료를 웹사이트에 게시하기
- Trouble Shooting(문제 해결)
- 동영상 자료
Google 비즈니스 통계를 가져오기
통계 데이터를 수동으로 내보내려면. 새 탭에서 통계(insight)를 열고 다른 탭에서 스프레드시트를 엽니다. Insights 페이지의 모든 콘텐츠를 복사하여 스프레드시트에 붙여넣습니다.
(GMB 통계 자료) 구글 스프레드 시트로 가져오기
구글 데이터 스튜디오와 연결하기 위해서는 구글 스프레드 시트에 통계 자료를 정리해야 합니다. 구글 스프레스드 생소하신 분은 아래의 엑셀로 가져오기를 먼저 한 다음 엑셀의 자료를 구글 스프레드 시트로 옮겨셔 작업하시면 됩니다.
- Ctrl + A(모두 선택)
- Ctrl + C(모두 복사)
- 여기에 스프레드 시트로 자료를 입력하는 방법을 정리해주세요.
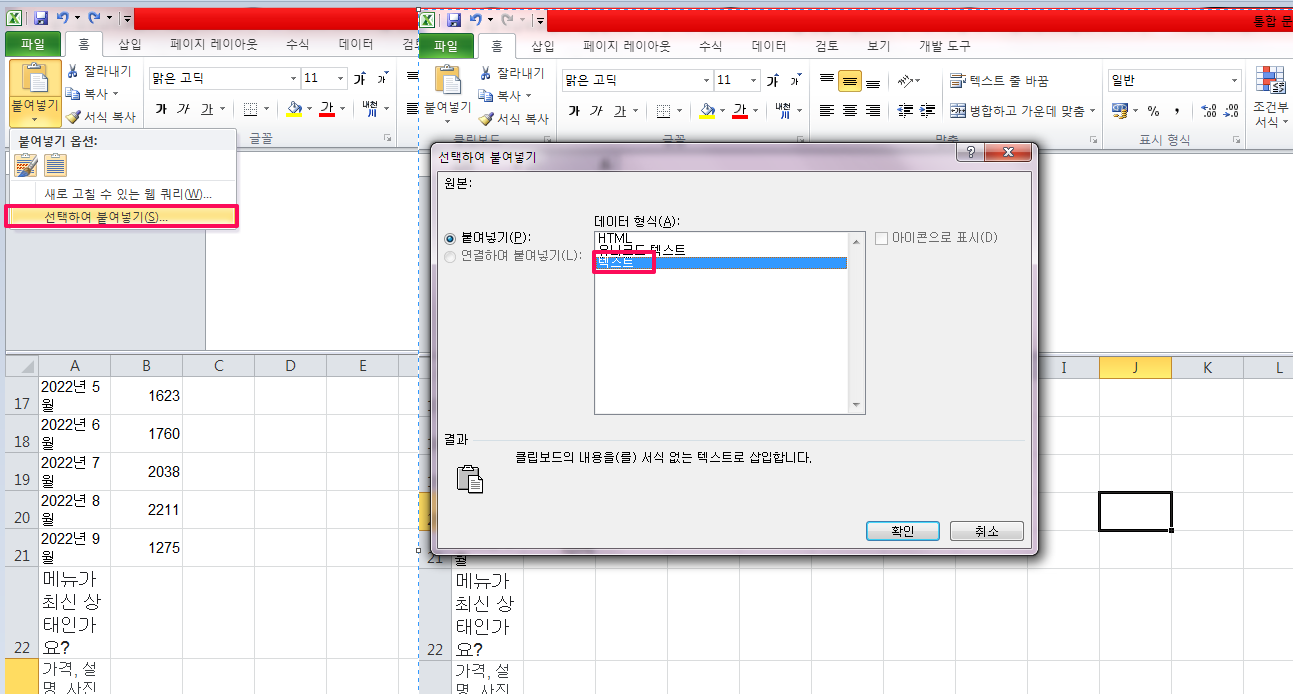
(GMB 통계 자료)엑셀로 가져오기
- Ctrl + A(모두 선택)
- Ctrl + C(모두 복사)
- Excel에 선택하여 붙여넣기 -> ‘텍스트 ‘ 또는 ‘값’만 선택하여 붙여넣기하면 텍스트만 가져와서 편집할 수 있는 상태가 됩니다.
- 엑셀로 편집한 이후에 구글드라이브로 옮기면 스프레드시트로 전환되며 이렇게 전환된 스프레스드시트를 이용하면 됩니다.
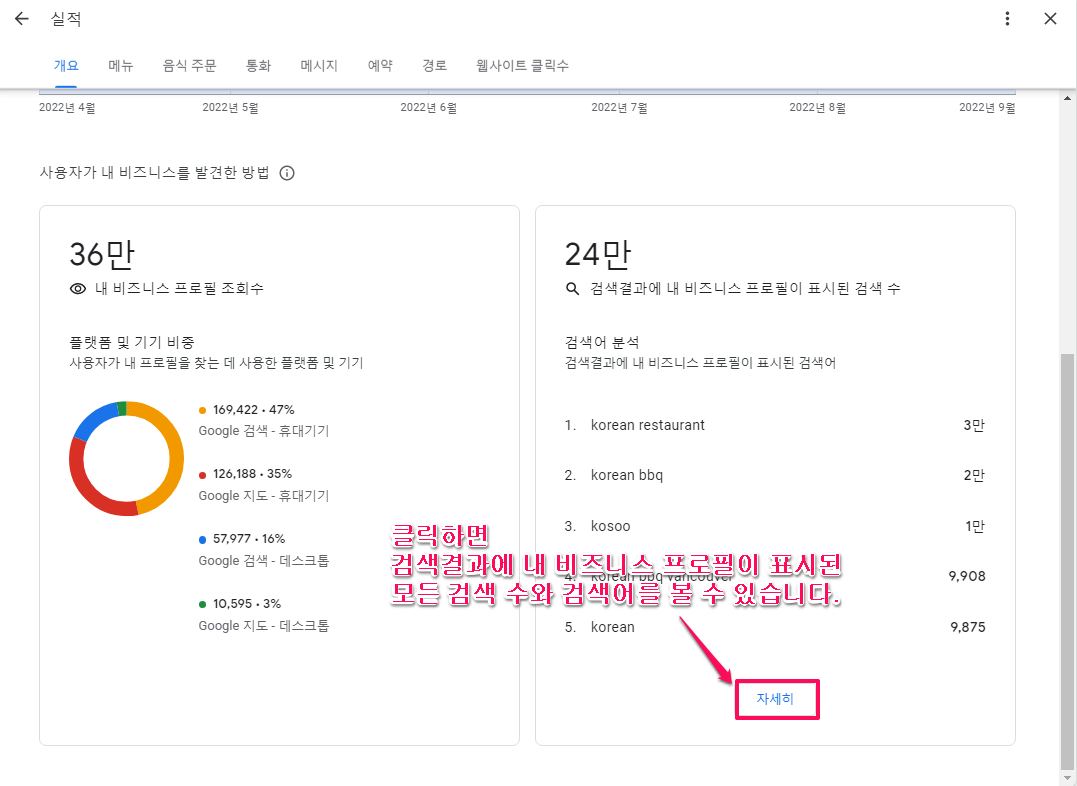
과거에는 통계(insight)에서 Ctrl + A(모두 선택)를 하면 통계 data를 가져올 수 있었으나 현재(22.9.25 기준)는 새 프로필 실적 보기클릭한다음에
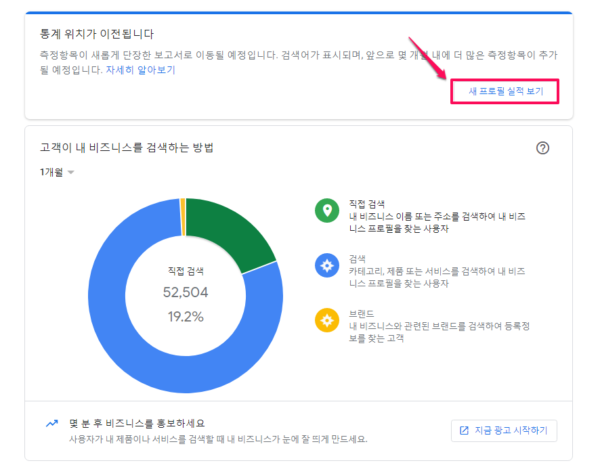
개요, 메뉴, 음식주문, 통화, 메시지, 예약, 경로, 웹사이트 클릭수의 월별 통계를 구할 수 있으며 검색어의 하단에 [자세히]를 클릭하면 검색결과에 표시된 내 비즈니스 프로필의 모든 검색어와 검색수를 확인할 수 있습니다. 게제순위까지 보려면 utm매개변수를 설정하고 구글 서치콘솔에서 확인해야 합니다.
https://business.google.com/reviews/l/09643892973961227758 와 같이 같은 방법으로 리뷰 페이지를 가져오면 리뷰 스키마도 마들 수 있을 것 같습니다. 적어도 해당 사업체의 리뷰를 쉽게 import할 수 있습니다. 조금 더 시도해 보세요.
리뷰는 홈에서 평균평점과 리뷰갯수를 가져와야 합니다.
검색에 표시되는 등록정보(예:24.9만), 지도에 표시되는 등록정보(예:112만)의 일별 실적을 가져올 수 없다는 것이 한계입니다.
구글스프레드시트 improt 함수를 이용하여 “=importhtml(“https://business.google.com/insights/l/09643892973961227758”, “table”,1)”처럼 가져오는 방법도 연구해보세요.
Google Sheets 자료를 Google Data Studio로 시각화하기
구글에서 ‘from google sheet to google data studio’ 으로 검색하면 자료 많습니다.
The Ultimate Guide: Google Sheets to Google Data Studio 로 모자라면 How to use Google Data Studio with Google Sheets 을 참조하세요.
The Ultimate Guide: Google Sheets to Google Data Studio
데이터 스튜디오에 직접 연결할 수 없는 데이터 소스가 많이 있습니다. 이러한 시나리오에서는 먼저 데이터를 Google 스프레드시트로 옮긴 다음 데이터 스튜디오로 옮길 수 있습니다.
기본적으로 Google 스프레드시트에 업로드하는 모든 데이터를 데이터 스튜디오로 가져올 수 있습니다.
단계별 절차
데이터를 이동하려면 Google 스프레드시트를 Google 데이터 스튜디오에 연결해야 합니다.
아래 단계에 따라 Google 스프레드시트와 Google 데이터 스튜디오를 연결할 수 있습니다.
1단계: 데이터 스튜디오 계정에 로그인합니다.
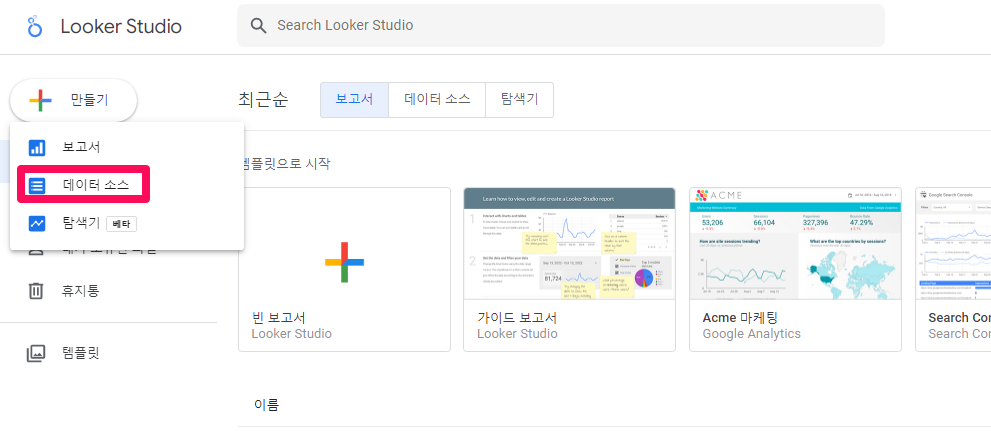
2단계: 창의 왼쪽 상단 모서리에 있는 “+만들기(CREATE)” 버튼을 클릭합니다.

( 이미지 출처 : The Ultimate Guide: Google Sheets to Google Data Studio )
3단계: 팝업되는 작은 창에서 “데이터 소스”를 선택합니다.
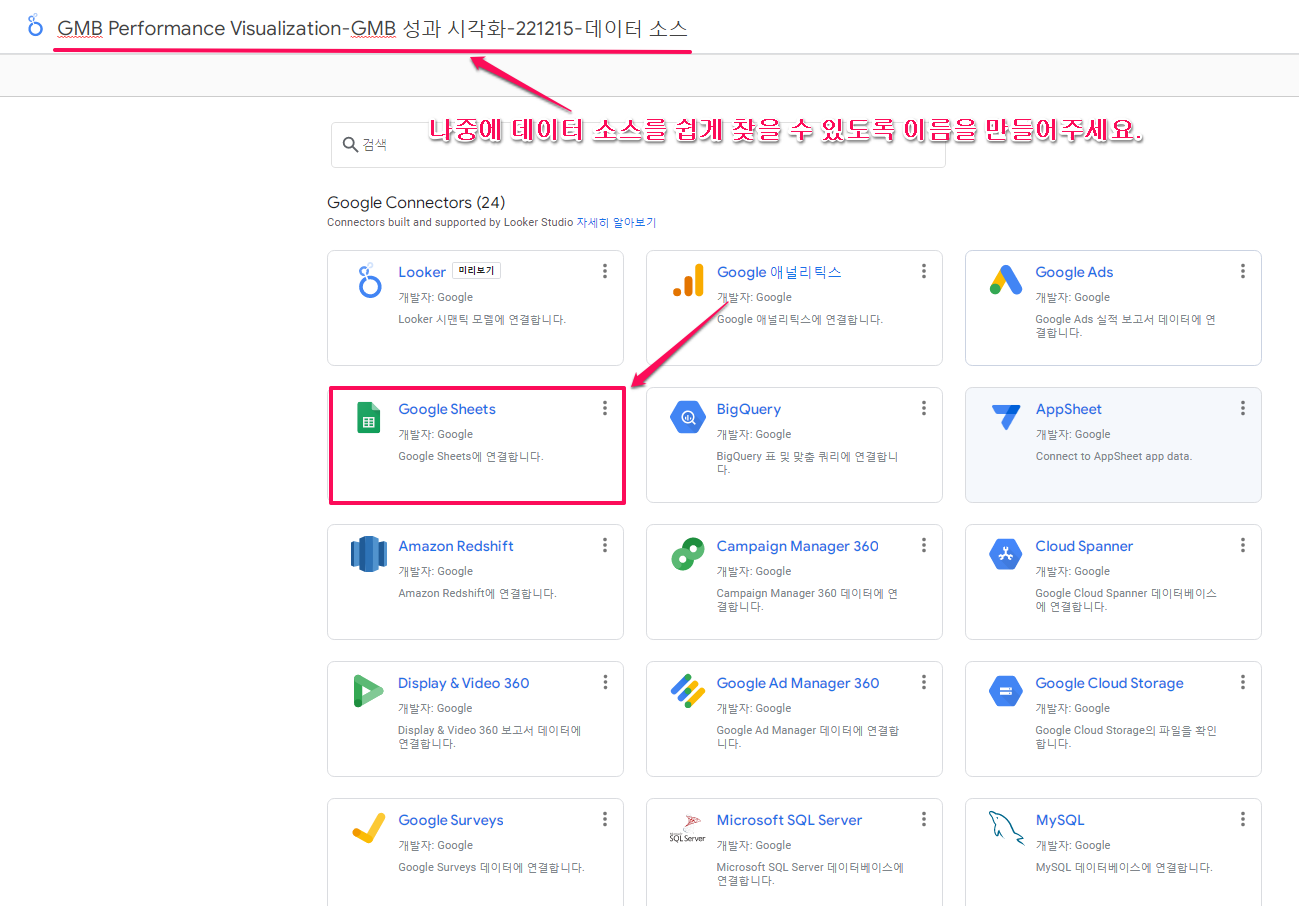
4단계: 다양한 데이터 소스에 대한 커넥터를 보여주는 페이지로 이동합니다. “Google 스프레드시트”를 선택합니다. 상단에 제공되는 검색창을 이용하여 검색하실 수도 있습니다.
구글데이터스튜디오-데이터소스에서Google 스프레드시트 선택 이미지를 넣어주세요.
5단계: 원하는 스프레드시트를 선택한 다음 워크시트를 선택합니다.

( 이미지 출처 : The Ultimate Guide: Google Sheets to Google Data Studio )
6단계: 창의 오른쪽 상단 모서리에 있는 “CONNECT” 버튼을 클릭합니다.

( 이미지 출처 : The Ultimate Guide: Google Sheets to Google Data Studio )
축하해요! Google Sheets에서 Google Data Studio로의 연결이 설정됩니다.
제한 사항
Google 스프레드시트를 Google 데이터 스튜디오에 연결할 수 있지만 Google 스프레드시트에서 Google 데이터 스튜디오로 실시간 데이터를 가져오는 간단한 방법은 없습니다.
Google App Script 및 Google Analytics 실시간 API를 사용해야 합니다. 즉, 일부 스크립팅 지식이 있어야 합니다. 당신이 프로그래머가 아니라면 이것은 당신에게 큰 도전이 될 것입니다.
Google Data Studio로 시각화한 자료를 웹사이트에 게시하기
아래의 게시글중 하단의 웹사이트에 게시하기 를 참조하세요. ( 웹사이트에 게시하기 를 클릭하시면 바로 해당 위치로 이동합니다. )
Trouble Shooting(문제 해결)
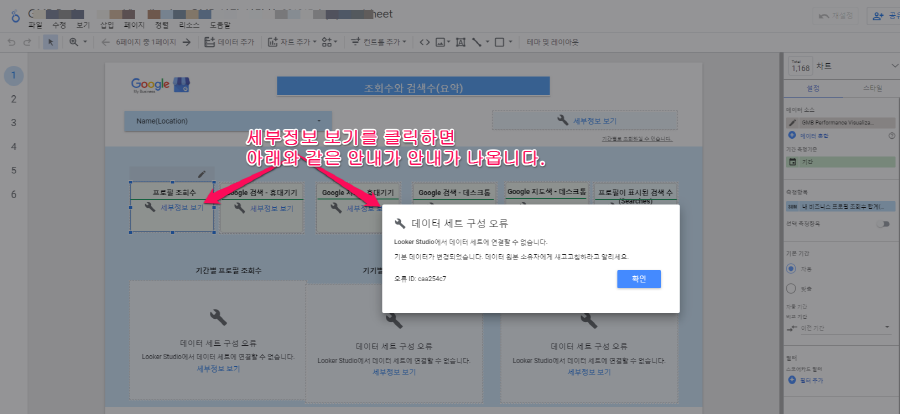
데이터 세트 구성 오류
Looker Studio에서 데이터 세트에 연결할 수 없습니다.
기본 데이터가 변경되었습니다. 데이터 원본 소유자에게 새고고침하라고 알리세요.
오류 ID: caa254c7
해결책
데이터 세트의 스키마 변경사항은 Looker Studio에서 자동으로 감지되지 않습니다.
선택하는 옵션에 따라 다음이 적용됩니다.
- 데이터 세트에 새 필드 추가
- 데이터 세트에서 필드 삭제
- 데이터 세트의 필드 이름 변경
- 데이터 세트의 필드 재정렬
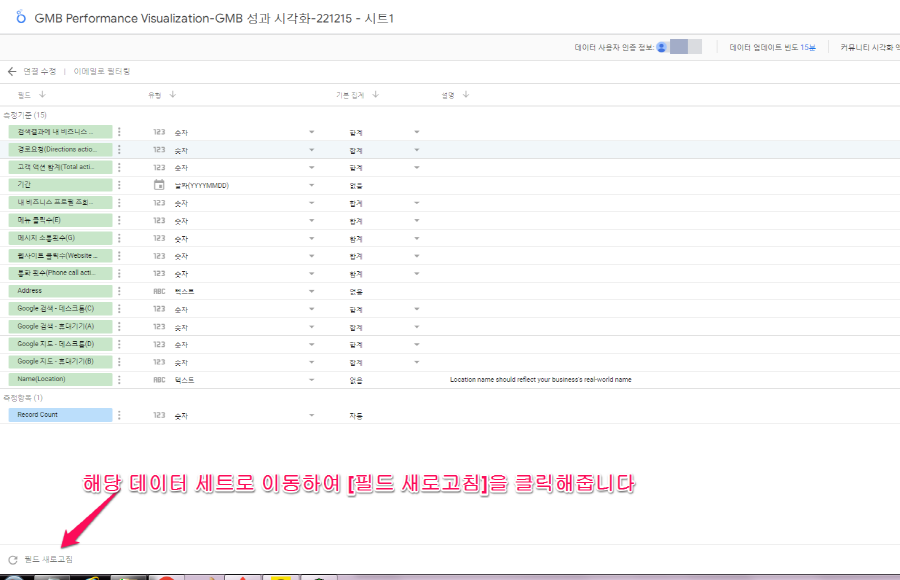
둘 다 일치하도록 데이터 소스 필드를 새로고침해야 합니다.
보고서에서 이용하고 있는 데이터 세트로 이동하여 왼쪽 하단에 있는 [필드 새로고침]을 클릭해줍니다. (부족한 부분은 데이터 소스 필드 새로고침 를 참조하세요. )
동영상 자료
Export Google My Business Insights into a Spreadsheet(5:07)
개요 파악 및 참조용으로 사용하세요. 핵심내용은 위에 ‘Google 비즈니스 통계를 내보내는 방법’에서 설명한 것입니다. 동영상을 보고 있으면 핵심은 휙지나가서 더 헷갈립니다.
유튜브 자막 다운로드 프로그램으로 다운로드 및 구글 번역하였습니다.
1
00:00:00,000 –> 00:00:04,319
Google 마이 비즈니스 페이지 비즈니스 google.com으로 이동하면 왼쪽에 있는 귀하의 홈페이지에서 귀하의 홈페이지로 이동합니다. 메뉴가 있고 통계를 클릭할 수 있으므로 여기에서 고객이 귀하의 비즈니스를 검색하는 방법을 알려줍니다.
1
00:00:00,000 –> 00:00:04,319
Google my business page if you go to
business google.com it’ll take you into your home page from your home page on the left side you have a menu and you can click on insights so here this is telling you how customers search for
7
00:00:12,690 –> 00:00:15,150
비즈니스 및 녹색을 보면 고객이 귀하의 이름 주소 전화번호를 입력하여 귀하의 목록을 찾는 방법입니다
7
00:00:12,690 –> 00:00:15,150
your business and if you look at the green that’s how customers find your listing by typing your name address phone number
11
00:00:21,270 –> 00:00:25,949
검색은 고객이 카테고리 제품 또는 서비스를 기반으로 귀하의 목록을 찾는 방법 이므로 여기에서 볼 수 있는 것은 이것이 제공하는 것뿐입니다
11
00:00:21,270 –> 00:00:25,949
Discovery is how customers find your listing based off of a category product or service and so if you look here what you can see is this only provides
15
00:00:33,059 –> 00:00:38,399
월별 및 분기별 정보에 대한 정보이므로 내가 읽고 있는 좌절감 중 일부는 잘 알고 있습니다.
15
00:00:30,510 –> 00:00:36,120
information as far as for the week for the month and for the quarter so some of the frustration that I’m reading about
18
00:00:46,200 –> 00:00:51,890
또는 연도부터 어떻게 하면 한 주 동안 이 작업을 수행할 수 있습니까?
한 주 동안 강조 표시할 수 있습니다.
18
00:00:38,399 –> 00:00:42,899
is well what if I want to compare from the first quarter did the second quarter or from the first quarter to the fourth
21
00:00:56,070 –> 00:01:00,989
고객이 귀하의 비즈니스를 검색하는 방식이나 고객이 귀하의 비즈니스를 보는 위치를 변경할 뿐만 아니라 비즈니스 Google의 모든 고객 작업에 대한 드롭다운 메뉴를 변경해야 합니다.
21
00:00:46,200 –> 00:00:51,890
quarter or from year how do I do that and so you can do this for the week you can highlight it for the week just make sure you change it not only do you
25
00:01:06,630 –> 00:01:12,810
고객 방향 요청 전화 통화 정보를 복사하고 스프레드시트에 다운로드하기 전에 모든 정보를 1주일로 변경하므로 모든 내용이 1주일 동안 표시 되는지 확인하십시오.
25
00:00:56,070 –> 00:01:00,989
change it on how customers search for your business or where customers view
your business on Google you’ve got to change that drop down menu on everything
29
00:01:23,100 –> 00:01:31,290
여기 이 빈 공간을 클릭하면 복사가 가능하고 Spreadshirt 스프레드시트에서 명령 V에서 붙여넣기가 가능합니다.
29
00:01:06,630 –> 00:01:12,810
customer actions customer Direction customer actions customer Direction requests phone calls change it all to one week before you copy your information and download it over into the spreadsheet so make sure everything
34
00:01:41,490 –> 00:01:47,280
스프레드시트를 밖으로 이동하여 필요하지 않은 항목을 삭제합니다. 예를 들어 이 항목이 필요하지 않다고 가정해 보겠습니다. 모든 항목을 강조 표시하기만 하면 ctrl 삭제 하고 보기 좋게 보이게 만들 수 있습니다.
34
00:01:20,189 –> 00:01:26,060
says for a week and then you so you just kind of click in this empty spot here command C for copy and then in your Spreadshirt spreadsheet command V for paste and there it is
39
00:01:57,899 –> 00:02:02,520
내 지난 30일 동안 총 검색 횟수를 표시하는 항목을 직접 찾은 항목을 찾은 횟수가 무엇인지 발견한 항목이 발견된 항목이 몇 번인지 총 조회수를 표시한 다음 이를 분류합니다.
39
00:01:37,079 –> 00:01:41,490
so that this is what it’s going to look like and you can tidy it up you know kind of move your spreadsheet out delete what you don’t need so let’s say for example you don’t need any of this stuff so you just highlight it all ctrl delete
45
00:02:10,800 –> 00:02:15,420
이 날짜에 목록 검색에 몇 번 나타났는지, 그리고 이 날짜에 지도에 몇 번 나타났는지 날짜별로 세분화됩니다. 30일 당신이 분기를 하면 그것은 당신에게 보여줄 것입니다 오 이번 주는 그것이 나타났을 때 분기의 날까지 당신을 보여줄 것입니다
45
00:01:53,070 –> 00:01:57,899
and you kind of make it look you know presentable and so here’s what I did with mine I’ve got the last 30 days which shows you the total searches any times where you found what is direct how many times have you been found what is discovery how many times what’s the total views and then it breaks it down
53
00:02:36,480 –> 00:02:43,500
그리고 당신이 음과 우리가 보고 싶은 것 괜찮아 오늘은 25일이었고 오늘은 17일 우리가 오늘 무엇을 했는가
이것과 다른 고객 행동을 앞으로 나아가는 방법을 알아내고 지난 30일의 날짜로 내려가서
53
00:02:10,800 –> 00:02:15,420
by date of how many times you showed up on listing search on this date and how many times you showed up on the map on this date and it breaks it down all the way I did a 30-day search so it breaks it down for those 30
59
00:02:56,610 –> 00:03:03,510
몇 개의 채팅을 보여줍니다 이제 채팅이라고 말할 때 Google 내 비즈니스 페이지 에서 개인이 문자 메시지를 보내거나 채팅할 수 있는 메시징 설정에 대해 이야기했습니다.
59
00:02:26,010 –> 00:02:31,140
days if you do the quarter it’s going to show you oh this one’s the week it’s going to show you down to the day on the
62
00:03:16,680 –> 00:03:26,239
Google 내 비즈니스 페이지의 버튼을 누르고 ph를 만듭니다. 원 콜 선택 누군가가 버튼을 클릭하면 이것이 추적되는 방법입니다. 웹 사이트를 방문하면 추적되는 방법입니다. 그런 다음 아래로 스크롤하여 총 작업을 모두 합산합니다.
62
00:02:33,600 –> 00:02:40,560
quarter every day of when it showed up and so then if you um and and what we like to look at is okay this day was 25 and this day was 17 what did we do this day that was different from this and figure out how to move forward customer
68
00:03:41,100 –> 00:03:47,630
세 개 또는 네 개의 운전 길찾기 사이에 전화가 걸려옵니다. 저는 이것이 가장 마음에 듭니다. 전화가 걸려오는 요일과 시간을 보여줍니다.
68
00:02:51,900 –> 00:02:56,610
actions you know it goes down to the date of the last 30 days and it shows how many chats now when it says chat to you we talked about this on setting up messaging to where an individual can
73
00:03:58,170 –> 00:04:04,080
가장 인기 있는 전화를 받은 시간과 사진 보기 이것은 우리가 정말 좋아하는 것입니다.
73
00:03:05,970 –> 00:03:11,550
text you or chat with you from your Google my business page so that’s what
75
00:04:05,700 –> 00:04:12,060
우리가 하는 일과 경쟁자들이 하는 일을 비교하기 때문에 계속 추적하고 싶습니다. 그래서 우리 사진 이 유사한 기업보다 863% 더 많은 조회수를 받도록 하고 싶습니다.
75
00:03:11,550 –> 00:03:16,680
chat to you is referring to calls are tracked by if somebody selects the call button on your Google my business page and um and makes a phone call select requesting directions just like this if somebody clicks on the button that’s how
81
00:04:20,700 –> 00:04:24,510
우리는 항상 Google 내 비즈니스 인사이트를 보고 있기 때문에 항상 이 수치를 확인하고 계속해서 뷰를 개선할 수 있는 방법을 묻고 있습니다. s
81
00:03:31,170 –> 00:03:36,209
it’s tracked visit your websites if they click on your website that’s how it’s tracked as well and then we’ll scroll down and it totals it all what your total actions are between the three or the four driving directions requests
87
00:04:36,629 –> 00:04:43,860
Google 마이 비즈니스 페이지에 사진을 추가하여 이와 같은 지속적인 보고서를 유지하는 것이 좋습니다. 그러면 한 분기에서 다음 분기로 비교할 수 있고 Google 마이 비즈니스에서는 최대 1분기에서 다음 또는 3개월까지의 통찰력만 허용하기 때문입니다. 대부분 이전 내용이 무엇인지 확인하기가 어렵기 때문에 Google 내 비즈니스 통계를 더 잘 추적하는 방법에 대한 간단한 방법일 뿐입니다.
87
00:03:47,630 –> 00:03:54,420
phone calls now I like this one it shows the phone calls day of the week and time of the day where what time you have the most popular phone calls made and then photo views this is something we really like to keep track of because it compares us between what we’re doing and what our competitors are doing and so we want to make sure that this one you know we our photos receive eight hundred and sixty-three percent more views than similar businesses and that’s because we’re always in the Google my business
100
00:04:22,320 –> 00:04:25,830
insights we’re always looking at these numbers and asking ways on how we can continue to improve our views and so the one way to do that is by adding photos to your Google my business page so it’s great to keep an ongoing report like this so we can compare from one quarter to the next and since Google my business only allows insights up from one quarter to the next or three months max at the most it’s kind of hard to see what the previous stuff was and so this was due this is just a simple way on how to keep better track of your Google my business insights
참고자료 : 1. Exporting Data from New Google Business Insights
2. How to Export Data from the Google My Business Dashboard Insights Report
3. The Ultimate Guide: Google Sheets to Google Data Studio